- 2024-12-12
[For Beginners] What is Bitcoin? An Easy-to-Understand Explanation of How It Works!
Bitcoin (BTC) is well-known as the leading cryptocurrency (d……

Technical analysis is one of the methods used to predict short-term price movements in cryptocurrency trading.
While using technical analysis can increase your chances of making profitable trades, it is often considered a challenging technique for beginners.
This article provides beginners with a detailed explanation of technical analysis, covering the basics, how to read charts, and practical steps to get started.
In cryptocurrency investing, technical analysis is a method of predicting future price movements by analyzing past market data, such as price trends and trading volumes.
In practice, traders use charts (graphs that show past price movements) to identify patterns and trends to make predictions.
When it comes to technical analysis in cryptocurrencies, we will explain it in detail from the following two perspectives:
The table below highlights the key differences between technical analysis and fundamental analysis in cryptocurrency trading.
| Technical Analysis | Fundamental Analysis | |
| Purpose | Analysis to determine the timing for buying and selling cryptocurrencies | Analysis to determine the right time to buy or sell a specific cryptocurrency. |
| Method | Predicts future price movements by analyzing past price trends on charts. | Analyzes the value of cryptocurrencies based on economic indicators. |
| Analysis Focus | Price data, trading volume. | Performance, economic conditions, political situations. |
| Investment Horizon | Short-term to medium-term. | Medium-term to long-term. |
| Key Indicators | Moving Averages, RSI, MACD, etc. | Revenue, Profit Margin, ROE, etc. |
Technical analysis is a method for predicting future price movements by analyzing past price trends on charts.
On the other hand, fundamental analysis evaluates whether the current price is high or low by considering economic indicators, such as global economic conditions and the financial status of companies.
While technical analysis focuses on “when” to buy or sell, fundamental analysis emphasizes “why” to buy or sell.
Technical analysis is primarily used in order book trading on cryptocurrency exchanges. For more information about order book trading, please refer to the following article.
Technical analysis is categorized based on different perspectives and criteria for reading charts.
In this section, we introduce the three main types of technical analysis:
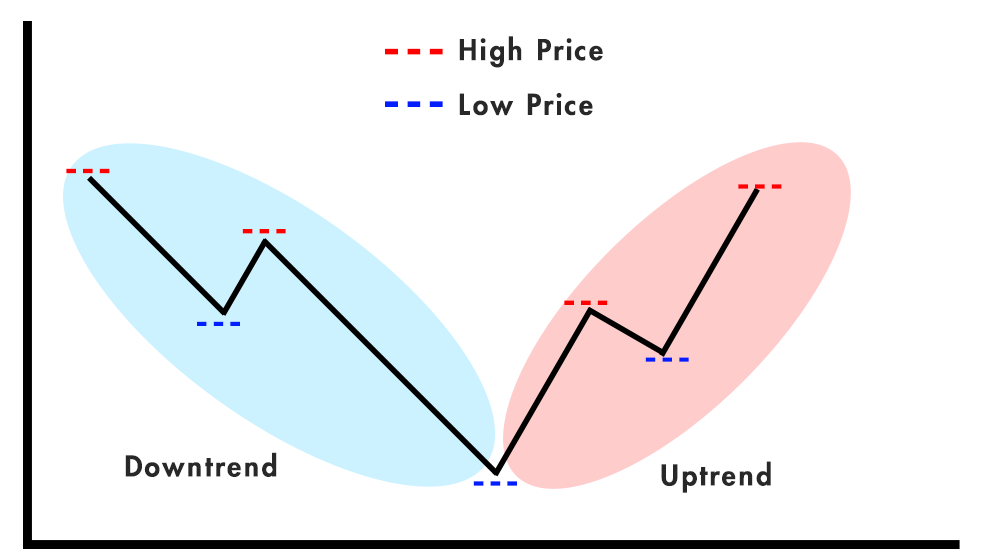
Trend analysis is a method of predicting future currency prices based on the overall trend (price movement tendencies) in the market.
In chart movements, if prices consistently rise over a given period, it is called an “uptrend.” Conversely, if prices consistently decline, it is called a “downtrend.”
When prices repeatedly move up and down within a fixed range, this is known as a “range-bound market.”
In trend analysis, it’s essential to develop the skill to identify whether the current market is in an uptrend, downtrend, or range-bound market.
To analyze market trends effectively, the following three trend indicators are useful
| Indicator | Characteristics |
| Stochastics | An indicator that compares the current price to the historical price range (highest and lowest values) and displays where the current price is within that range as a percentage. |
| RSI (Relative Strength Index) | An indicator that measures the ratio of the average gains and losses over a specific period, displaying a value between 0 and 100 to indicate whether the market is overbought or oversold. |
| MACD (Moving Average Convergence Divergence) | An indicator that graphs the difference between short-term and long-term moving averages, showing the strength, direction, and potential reversal points of market trends based on price movements. |
Oscillator analysis is effective when prices are moving within a range-bound market rather than trending up or down.
Formation analysis is a method that identifies specific patterns on charts to predict future price movements.
In cryptocurrency trading, when price movements are connected by graph lines, the following patterns can often be observed:
*Graph lines are lines that visualize price movements on a chart.
| Pattern | Characteristics |
| Double Top | A pattern that appears at the final stage of an uptrend, indicating a potential trend reversal to the downside. |
| Double Bottom | A pattern that appears at the final stage of a downtrend, indicating a potential trend reversal to the upside. |
| (Inverse) Head and Shoulders | A pattern where three peaks form on the chart, indicating a potential trend reversal. In the case of a reverse (inverse) head and shoulders, the pattern signals a reversal from a downtrend to an uptrend. |
| Triangle Pattern | A pattern where the price consolidates within a narrowing range for a period, indicating a range-bound market before a potential breakout in either direction. |
Using formation analysis, you can refer to past chart patterns to make it easier to predict future price movements.
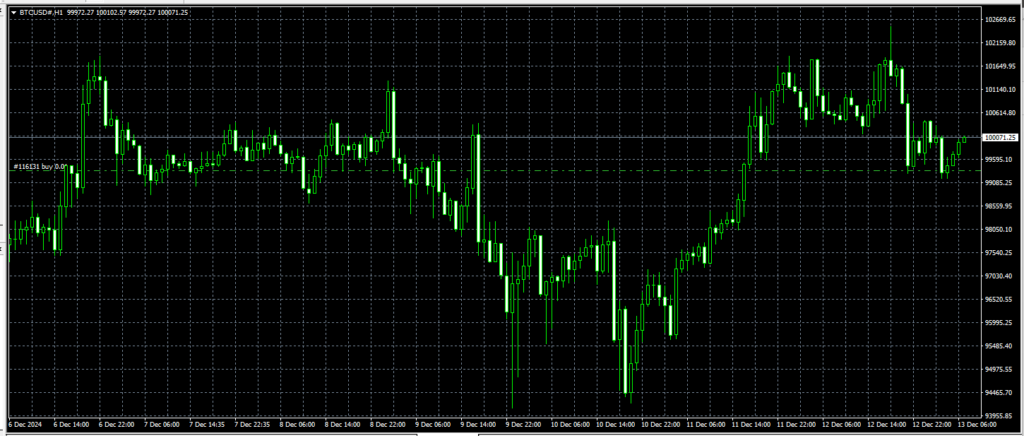
In cryptocurrency technical analysis, there are two basic types of chart patterns to understand. Here’s an explanation of each:
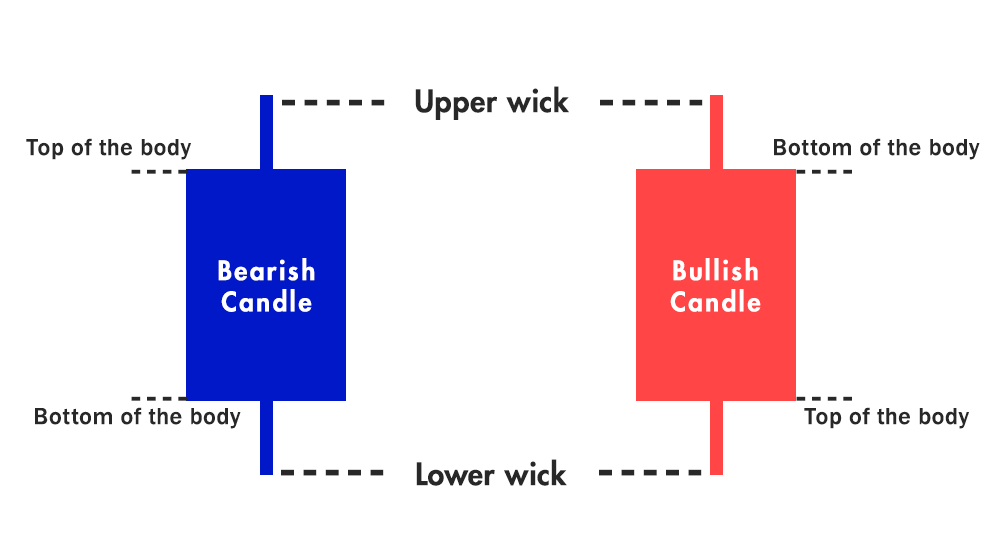
A candlestick chart summarizes four price points within a set time frame: the opening price, high price, low price, and closing price.
The chart features a thick bar called the candlestick body (which can be a bullish or bearish candle) and thin lines extending above and below the body, known as wicks or shadows (representing the high and low prices).
The body of the candlestick indicates the opening and closing prices.On the Japanese cryptocurrency exchange “bitbank,” the bullish candle (up candle) is shown in green, and the bearish candle (down candle) is shown in red (these colors can be adjusted in the settings).
A bullish candle (green) appears when the closing price is higher than the opening price.
A bearish candle (red) appears when the closing price is lower than the opening price.
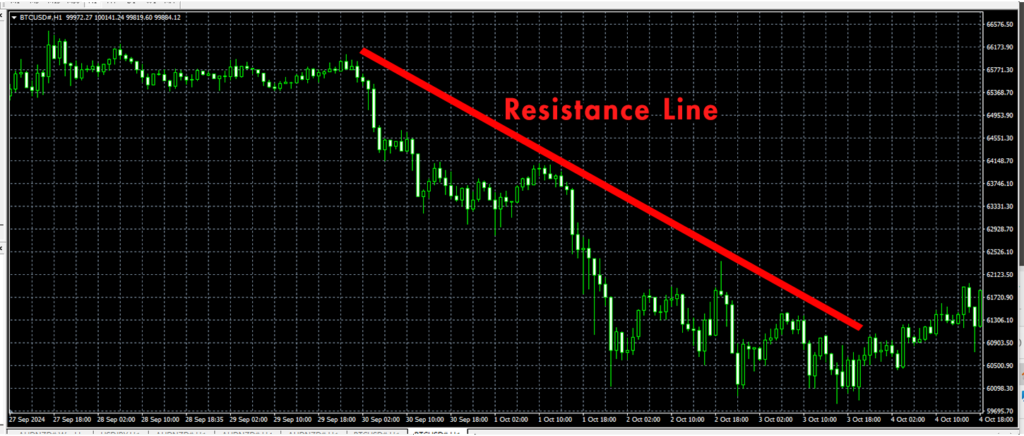
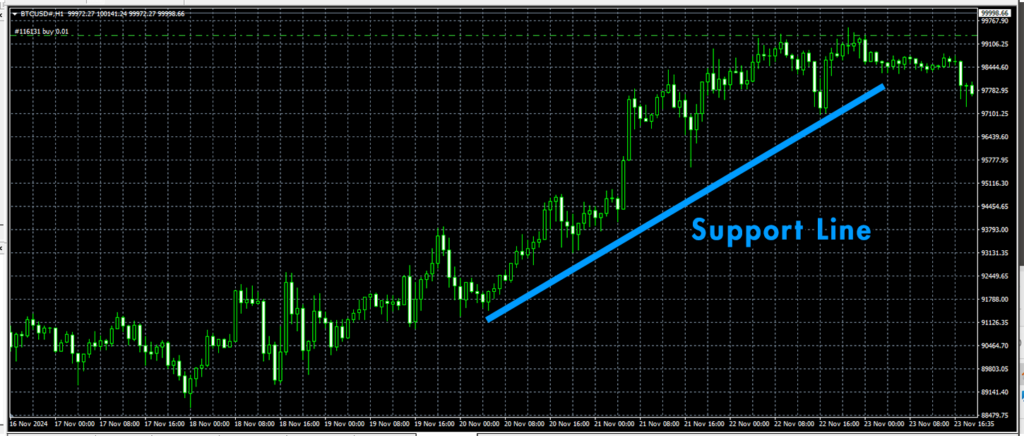
Resistance and support lines are indicators used to gauge how far prices are likely to rise or fall.
Using resistance and support lines helps you identify the timing of potential transitions into uptrends or downtrends. By applying these two lines, you can more accurately interpret price movements.
Let’s explore the key benefits of using technical analysis in cryptocurrency trading.
Analyzing trends and chart patterns with technical analysis helps you make accurate short-term price predictions.
Cryptocurrencies have greater volatility (price fluctuations) compared to other financial assets, often experiencing rapid price swings in short periods.
Technical analysis is an effective tool in the cryptocurrency market for capturing these short-term price movements.
Additionally, technical analysis allows you to make data-driven trades, helping you stay calm during sudden price changes and reducing the risk of impulsive decisions.
By mastering technical analysis, you can make rational investment decisions.
Technical analysis utilizes various indicators, such as charts, trading volume, and moving averages.
These indicators help you understand investor psychology and behavior patterns, allowing you to make well-informed investment decisions.
For example, if Bitcoin’s price and trading volume are increasing, many investors may consider it a good time to buy. However, by analyzing an indicator like the RSI (Relative Strength Index), you may determine that the market is overheated and decide to avoid buying, thus preventing potential losses.
Using various technical indicators increases your ability to identify the best timing for buying and selling.
Technical analysis helps you recognize market trends, which is crucial for securing profits and avoiding losses.
By understanding market trends—whether the market is bullish (uptrend), bearish (downtrend), or in a range-bound (sideways) market—it becomes easier to predict future price movements.
For example, if a chart shows a long period of range-bound movement followed by noticeable price changes, it may signal a trading opportunity:
By effectively using indicators to identify trends, you can maximize profits while minimizing risks.
While technical analysis is useful for understanding market trends and predicting price movements, there are three key drawbacks to be aware of:
Cryptocurrency markets operate 24/7, generating an overwhelming amount of data.
In technical analysis, you need to process large volumes of information, which can be difficult for beginners to navigate. Deciding which data to analyze can be challenging, increasing the risk of incorrect analysis.
Tip for Beginners:
Technical analysis involves numerous indicators, such as moving averages, RSI, and MACD, each with unique characteristics. Mastering these methods and applying them correctly takes time.
The most suitable analysis method varies depending on your investment style, making it difficult to learn and use all methods effectively. Beginners may struggle with deciding which method to use.
Tip for Beginners:
Start by using just one or two methods. Once you’re comfortable, gradually experiment with additional methods.
Technical analysis makes it difficult to execute trades based on expected value (the average potential profit or loss of a trade). Predicting future market movements solely with technical analysis can be challenging.
Note
Cryptocurrency prices are heavily influenced by external factors, such as regulatory changes, economic news, or statements from influential figures. These factors can lead to sudden price swings that technical analysis cannot fully anticipate, making it harder to manage risk effectively.
Risk Management Tip
Understand that technical analysis cannot guarantee accurate future predictions. Practice good risk management to minimize potential losses.
By being aware of these limitations, you can use technical analysis more effectively while managing your risks.
Here’s a clear and natural English translation of the provided text:
Even after understanding the basics of technical analysis, you might still wonder, “Does it really work in practice?”
In this section, let’s conduct a technical analysis using an actual chart. The candlestick chart below shows market trends from February 14 to February 17, 2024.
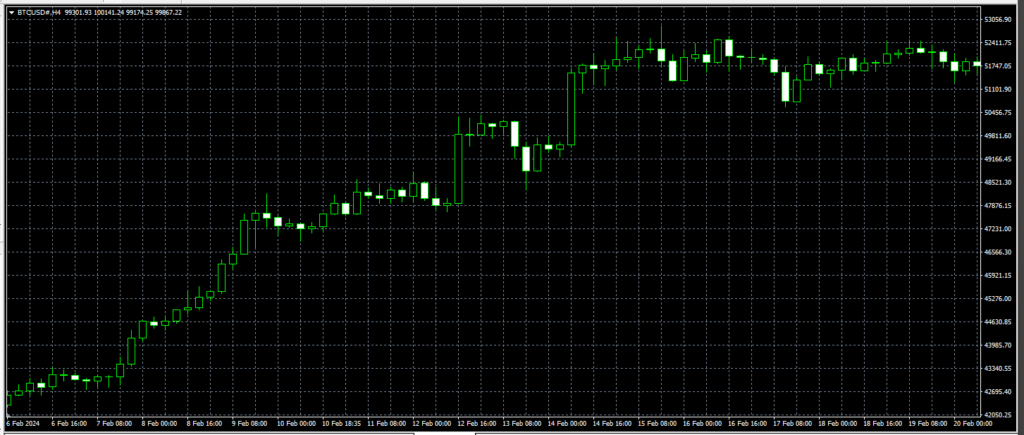
As an overall trend, there was significant price movement on February 14. However, after that, the market entered a range-bound phase (sideways movement), with prices fluctuating between 7,800,000 yen and 7,900,000 yen.
Based on this information, technical analysis shows that from February 15 to February 17, there is no clear uptrend or downtrend.
For future investment decisions, it would be wise to wait for a clear trend to emerge. Once a trend is established, you can implement a trend-following strategy—buying during an uptrend and selling during a downtrend.
* Trend-following strategy: An investment approach that follows the market trend. If the market is in an uptrend, you buy; if it’s in a downtrend, you sell.
By trading according to the trend, you increase your chances of making a profit.
Technical analysis is a convenient method for predicting future prices based on historical charts. However, if you use it without understanding its limitations, you may incur unexpected losses.
Here are three key points to keep in mind when using technical analysis:
Relying solely on technical analysis may cause you to overlook the impact of economic conditions or sudden news events related to countries or companies.
For example, in 2021, China banned cryptocurrency payments. At that time, Bitcoin was approaching an all-time high of $60,000, but within a week, the price dropped to around $30,000.
To mitigate risks, combine technical analysis with fundamental analysis, which considers economic indicators and broader market factors.
While technical analysis is an effective tool for cryptocurrency trading, over-relying on its results can lead to losses.
Cryptocurrency prices are influenced by factors such as economic news and regulatory changes, making precise predictions difficult. Because the crypto market is highly volatile, unexpected price swings can result in significant losses.
Avoid overtrusting analysis results and accept that some losses are inevitable. This mindset will help you trade more rationally.
Technical analysis offers a wide variety of indicators and chart patterns. Rather than relying on just one indicator, combine multiple indicators to perform a comprehensive analysis.
For example:
Mastering multiple indicators takes time and experience. For beginners, it’s best to learn one indicator at a time and gradually apply them in practice.
Technical analysis in cryptocurrency trading helps you understand market trends and investor sentiment, leading to more informed investment decisions.
Given the wide range of indicators available, beginners should start by mastering one indicator before gradually expanding their toolkit.
While technical analysis is useful, remember that predicting future price movements with 100% accuracy is impossible. Use technical analysis as a guide, but always manage your risks.