Gold Prices Near All-Time Highs: Why Investors Are Focusing on Safe Assets
Gold Daily Chart
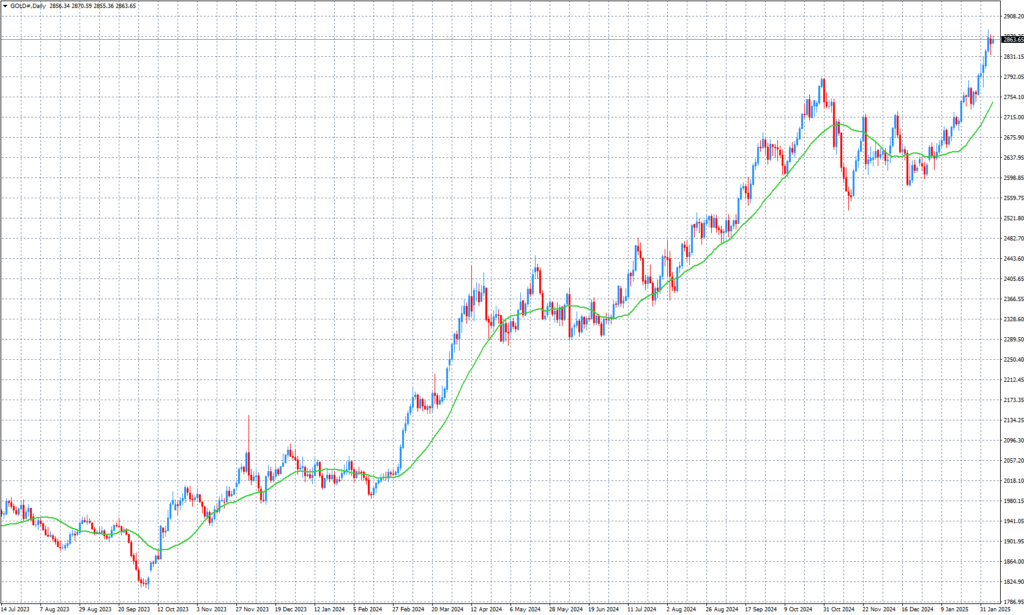
Gold prices have surged recently, approaching record highs. This movement is driven by uncertainty ahead of the U.S. non-farm payroll data release, along with heightened geopolitical tensions and the U.S.-China trade war. A weakening U.S. dollar has further supported gold prices. Analysts forecast that gold may continue to rise, potentially reaching $3,000 per ounce in the short term. For beginners, gold remains a promising investment option.
Future Outlook and Predictions
The attached chart reveals a consistent upward trend in gold prices from 2023 to 2025. Particularly since mid-2024, the momentum of this rise has strengthened, with recent prices nearing the critical $2,900 level. This movement can be attributed to the following factors:
- Increased Demand for Safe-Haven Assets
The intensification of the U.S.-China trade war and growing geopolitical risks in the Middle East have heightened demand for gold as a safe-haven asset. In uncertain times, investors often turn to gold to hedge against risks. - Impact of a Weak Dollar
As the U.S. dollar weakens, the relative value of gold increases, driving up its price. The recent market trends show a sustained weakening of the dollar, contributing to gold’s rise. - Interest Rate Dynamics
The Federal Reserve’s reluctance to lower interest rates has also supported gold demand. Lower interest rates make holding gold more attractive due to reduced opportunity costs.
Analysts predict that gold prices may reach the $3,000 mark in the short term, as suggested by the current market momentum. If the upcoming non-farm payroll data underperforms expectations, gold prices are likely to climb further. Conversely, a strong labor market report might lead to a temporary price correction. Nevertheless, the long-term trend for gold remains bullish.
Investment Decision
- Market Trend
The market is currently in an upward trend. - Recommended Investment Duration
Medium to long-term investment is recommended.
Explanation for Beginners
For those inspired by this article and chart to start investing in gold, using the moving average shown on the chart (green line) is a practical and straightforward way to guide your decisions.
- Use the Moving Average to Identify Buy Opportunities
Currently, the gold price is above the moving average, and the moving average is trending upward. This indicates a bullish market, making it an ideal time to consider buying gold. - Buy When the Price Approaches the Moving Average
If there is a short-term price correction, look to buy when the price gets closer to the moving average. The moving average often acts as a support level, providing a safer entry point for your investment. - Monitor the Trend Regularly
After investing, continue to monitor the trend. If the price falls below the moving average or if the moving average starts to slope downward, it may indicate a weakening trend. At that point, consider taking partial profits or reassessing your position.
Start small and familiarize yourself with identifying entry points and trends using the moving average. With the current strong upward trend, this is an excellent opportunity to begin your gold investment journey!
Related articles see the related articles.

- 2025-01-21
President Trump Considers 25% Tariffs on Imports from Mexico and Canada
President Trump announced plans to impose a 25% tariff on al……
- 2025-02-13
Bitcoin Market Analysis: Navigating Inflation and Geopolitical Risks
Bitcoin Daily Chart Today, Bitcoin’……
- 2025-01-22
Asian Currencies Decline on Trump’s Tariff Concerns; Malaysian Ringgit Rises on Rate Hold Expectations
President Trump’s indication of imposing a 60% tariff ……