- 2025-01-27
Asian Currencies Rebound on Trump’s Rate Cut Request; Yen Strengthens with BOJ Rate Hike
Recently, U.S. President Donald Trump’s call for a rat……

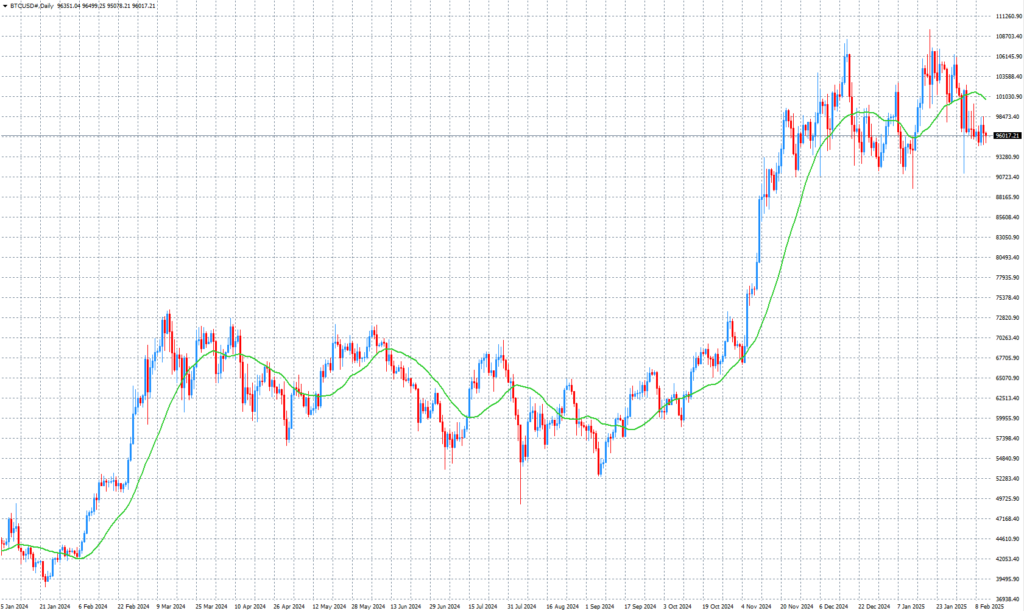
Bitcoin Daily Chart

Bitcoin continues its decline today, dropping to around $95,900. This is due to traders being cautious ahead of the U.S. inflation data (CPI) release today, as well as comments from the Federal Reserve (FRB) chairman dampening hopes for an early rate cut. The attached chart shows that Bitcoin experienced a sharp rally from December to January but is now in a correction phase. Depending on the CPI results, Bitcoin may experience further volatility, making careful trading essential.
The Bitcoin market is at a crucial turning point, influenced by three major factors:
Short-term traders should wait for the CPI results, while long-term investors may consider accumulating during price dips.
The current Bitcoin market may present a great entry opportunity. Looking at the chart, the price is undergoing a temporary correction, which often leads to another upward trend. This makes the current price range quite attractive for long-term investors.
Using an FX broker allows you to start trading Bitcoin with a small investment. Even beginners can trade easily, so starting with a small amount is a great way to get familiar with the market.